Concepts
- Meters:
- Timer:
- Counter
- Gauge
- DistributionSummary
- LongTaskTimer
- FunctionCounter
- FunctionTimer
- TimeGauge
How to Implement
Spring Actuator: supplies several endpoints in order to monitor and interact with your application.
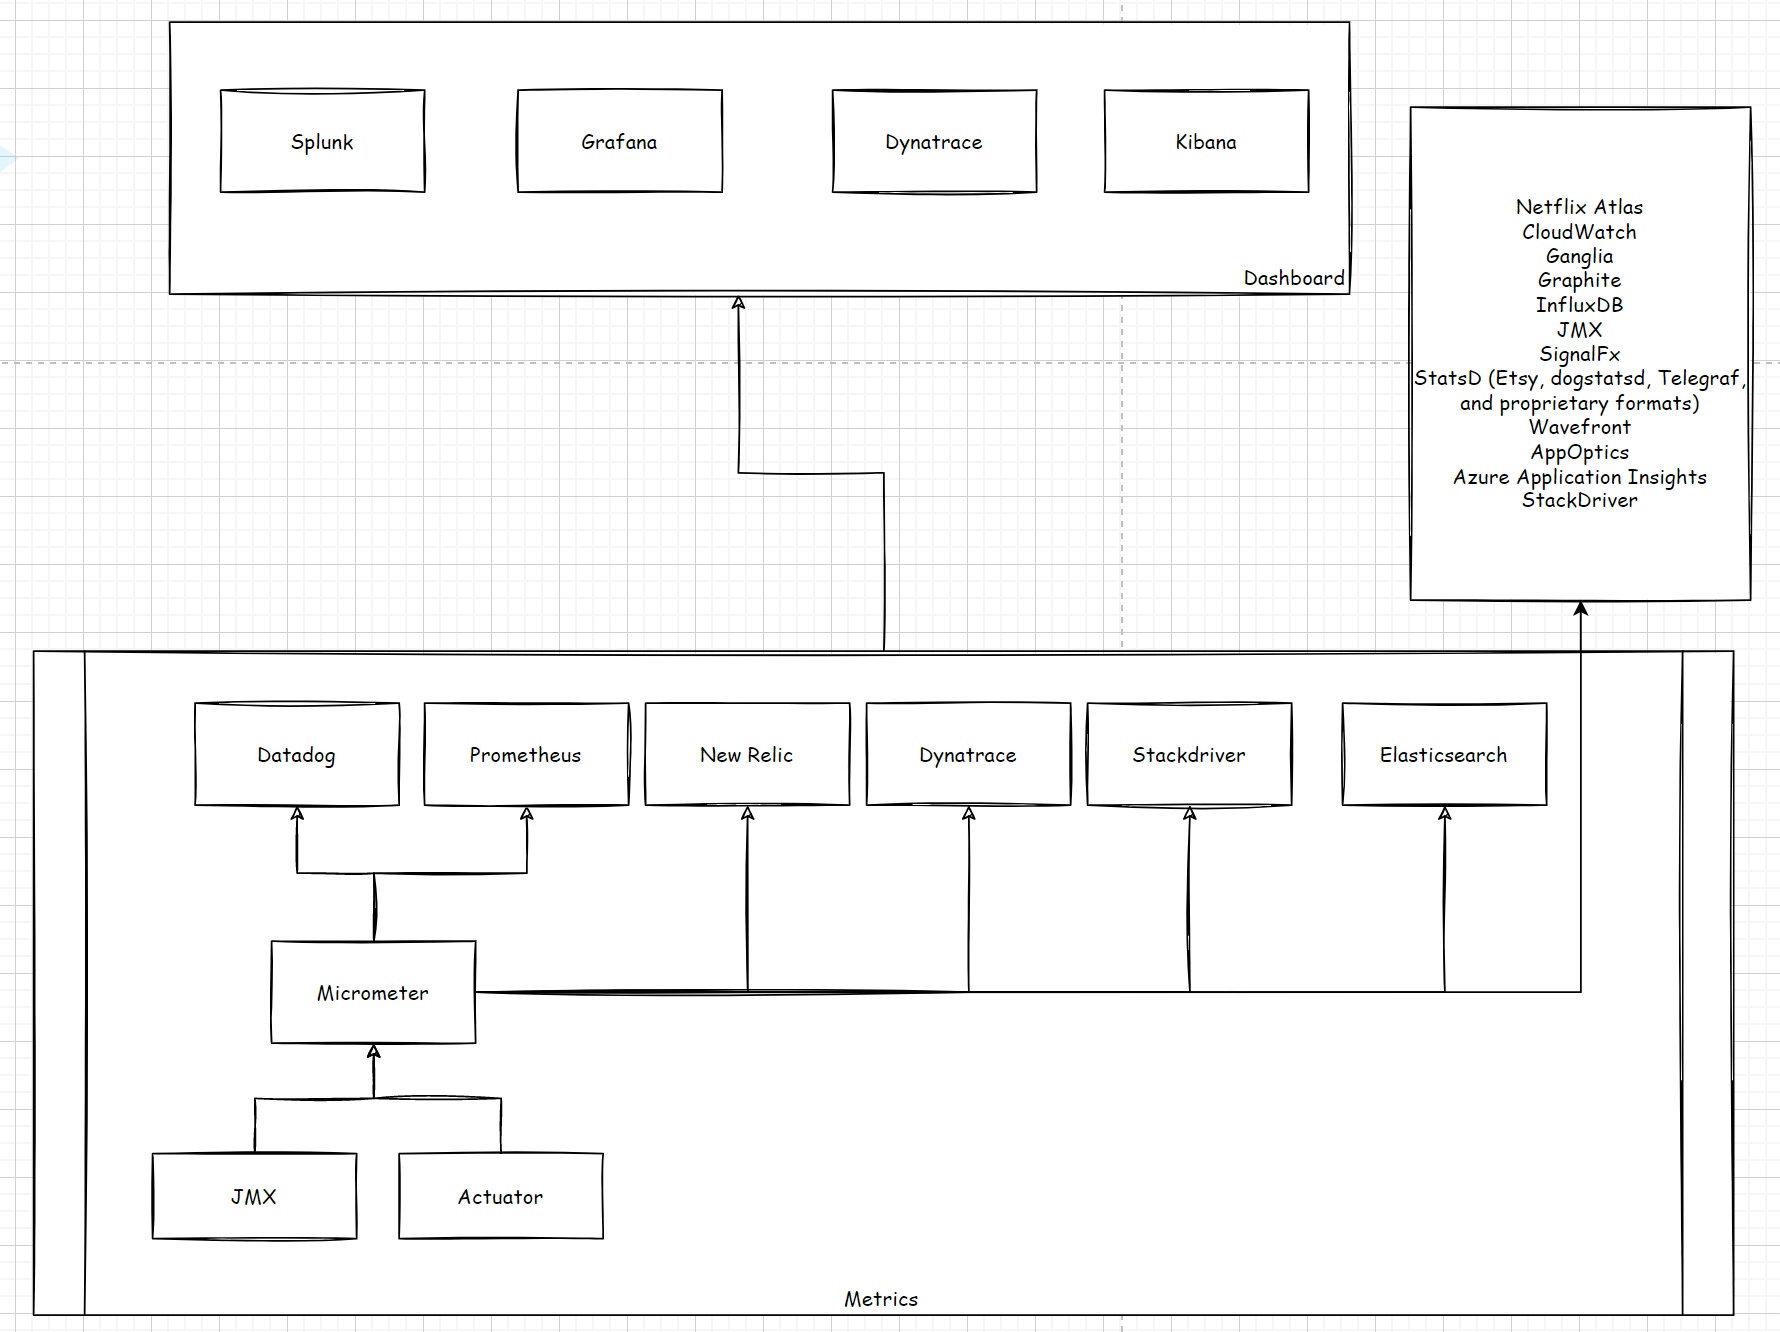
Micrometer: an application metrics facade that supports numerous monitoring systems, Spring Boot Actuator provides support for it.
Prometheus: a timeseries database in order to collect the metrics.
Grafana: a dashboard for displaying the metrics.
Example Implementation
This is implemented using Spring Boot application with the help of Spring Actuator, Micrometer, Prometheus and Grafana.
https://github.com/nayakmk/monitoring-prometheus-grafana-k8s
There are lot of metrics aggregation systems which can be integrated and above was an example of that. The complete list of metrics systems and their integration you can find below.
Further Reading
https://rskupnik.github.io/spring-metrics-with-micrometer-and-splunk
https://medium.com/@dwijsheth/a-to-z-guide-for-spring-boot-application-monitoring-e93b64722390
https://micrometer.io/docs/concepts#_meters
